


Many companies believe they are measuring their productivity the right way simply because they calculate OEE on a monthly basis or at the end of each shift.
It is a common scene for hundreds of industrial managers at the end of every month: the closing spreadsheet hits the screen, the formulas run, and the report points out that the OEE indicator of the main production line stood at 78%. On paper, the number looks acceptable, very close to the established target. However, on the shop floor, the reality is quite different. The supervisor knows that the accumulated rework was exhausting, the maintenance team spent the week putting out fires, and the operational reality feels like productivity fell far short of expectations. But why is there such a chasm between the reported indicator and reality?
Achieving greater maturity in production management requires going beyond the basic calculation of availability, performance, and quality. It is necessary to learn how to identify the errors and deviations that compromise the reliability of the indicators and limit decision-making.
In this article, we present four practical tips to help your operation overcome these challenges and turn OEE into a more effective tool.
Tip 1: ensure data is reliable right from the source
The first step toward achieving an accurate OEE calculation is eliminating the dependency on manual forms and logs. Relying on paper spreadsheets and notes taken at the end of a shift is one of the leading sources of error in the industry, compromising information quality and, consequently, decision-making.
This manual method introduces subjectivity when classifying downtime reasons and leads to the rounding of stoppage durations. It is not uncommon for a 17-minute stoppage to be logged as 15 minutes and placed into generic categories like “mechanical fault” or “maintenance.” As a result, the root cause of the problem remains hidden, hindering precise analyses and more effective corrective actions.
Another critical factor in manual records is the recurring gap between actual physical production and logged production. This type of error typically manifests in two main ways within the performance calculation:
- – The simple average calculation error: this occurs when attempting to consolidate OEE over a period by calculating the simple average of each machine’s individual performance. This approach is flawed because it disregards the fact that different products have different operation times and cycle speeds, completely ignoring the true weight of each batch.
- – The gross quantities calculation error: this involves evaluating efficiency simply by dividing the total quantity produced by the planned quantity. This simplification can generate highly distorted results when the line processes items with vastly different production volumes. In this scenario, the strong performance of one product can mask the low productivity of another, failing to reflect the actual efficiency of the machine time consumed.
To demonstrate the impact of these distortions, the table below compares the incorrect calculation (based on aggregated quantities or simple averages) with the actual calculation of required operational time, considering two products processed on the same machine during an 8-hour shift:
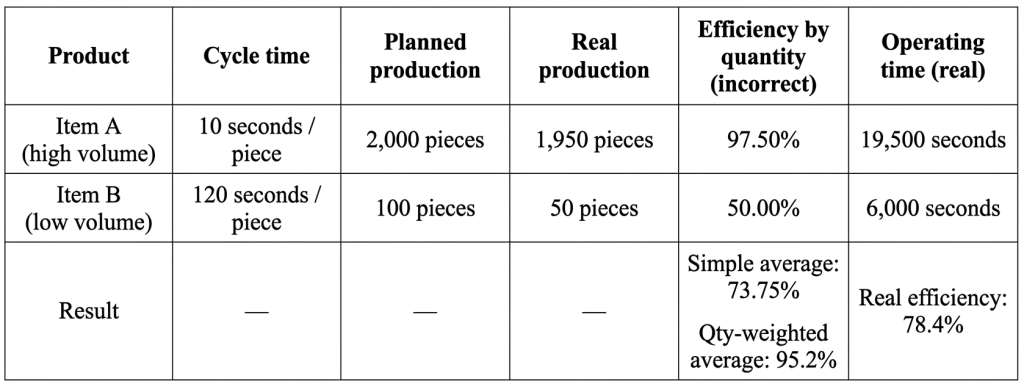
Calculating based solely on the number of pieces produced can indicate high efficiency, such as 97%, due to the weight of the volume produced by Item A.
However, this result hides the fact that the line lost half of the scheduled capacity for Item B, which requires a longer cycle time, generating a false perception of operational efficiency.
Adopting automated data capture systems eliminates this type of distortion. Through sensors and controllers, it is possible to record the start and end of each production cycle without intervention, ensuring greater precision in calculations and a more faithful view of the operation’s performance.
Tip 2: do not ignore micro-stoppages
Your production line might seem to operate normally, yet suffer small interruptions throughout the day: a misaligned sensor requiring a 30-second reset, a momentary component jam on the conveyor solved by the operator themselves, or a brief supply shortage that halts the process for a minute. Because these events rarely require maintenance intervention, they typically remain off the records.
This is one of the most common errors in efficiency measurement. Although almost imperceptible, micro-stoppages accumulate losses over time.
Consider a machine that experiences 40 one-minute interruptions during an eight-hour shift. In isolation, none of them seem relevant enough to be logged. Combined, however, they represent 40 minutes of lost production, meaning nearly 10% of the shift’s available time disappears without being reflected in availability reports.
In the OEE calculation, these losses are masked and end up impacting the performance indicator. Since the downtime was not recorded, the system assumes the machine remained available throughout the entire period but operated below its capacity. The result is an incorrect diagnosis of the root cause behind this loss.
Because of this, identifying and monitoring micro-stoppages is fundamental to understanding the actual performance of your operation.
Tip 3: analyze each OEE component separately
An OEE of 80% sounds excellent, right? It depends entirely on how that number was constructed. Looking only at the final indicator score is one of the most dangerous habits in industrial management, as general averages have the ability to hide efficiencies—but also the major deficiencies of an operation.
Consider two distinct scenarios within the same factory:
| Component | Line A (theoretical scenario) | Line B (balanced scenario) |
| Availability | 98% (The machine barely stops) | 85% (Scheduled stoppages and setup) |
| Unmatched Performance | 95% (Maximum speed) | 95% (Constant pace) |
| Quality | 65% (High scrap rate) | 99% (Controlled process) |
| Final OEE | 60,4% | 79,9% |
In Line A, the overall OEE is compromised by critical performance in the Quality component. Although the machine operated at maximum speed throughout the entire period, a significant portion of production was turned into scrap or will require rework. In this scenario, the costs of wasted raw material, rework, and lost efficiency become far more significant.
Line B, on the other hand, even while presenting lower Availability, maintains high levels of Performance and Quality. This represents a more predictable, stable, and profitable operation, with more controlled losses and higher reliability in its results.
The main takeaway here is: OEE should not be analyzed solely by its final value. It is essential to track each of the three components individually. When Availability drops, the focus must be on reducing downtime, optimizing setups, and improving maintenance strategies. If Performance is below expectations, it is worth investigating factors like machine wear, equipment conditions, and team training. Meanwhile, Quality issues require an analysis of process parameters, raw material specifications, and production controls.
A consolidated OEE shows the result. The three components, in turn, reveal where the root cause of the problem lies and point the way toward improvement.
Tip 4: stop finding problems only at the end of the day
Production in highly competitive environments requires transitioning from a reactive approach to data-driven management in real time. Calculating OEE only at the end of a shift or month is like driving while only looking through the rearview mirror: you only find out that you took the wrong route after you have already missed the correct turn.
To enable this agility, investing in an Industry 4.0 technological system offers the robust tools needed to integrate shop floor variables directly into management systems. However, capturing, processing, and transmitting this data requires a well-structured technological architecture composed of different automation layers:
| Tecnology | Role in OEE calculation | Operation mechanism |
| PLC | Physical data collection at the machine | Directly captures sensors, piece counts, and the main motor activation status. |
| Edge Computing | Local data processing | Executes the initial calculation of cycles and filters machine events, ensuring rapid responses without overloading the network. |
OPC UA protocol | Internal signal standardization | Acts as a “local interpreter” within industrial networks, translating specific PLC signals from different manufacturers into structured data models. |
| MQTT protocol (with Sparkplug B) | Efficient data transmission to the cloud | Transmits structured factory data to corporate dashboards using a lightweight publish/subscribe architecture. |
| IoT plataforms | Complete visualization of data collection | Consolidates data transmissions and displays information on screens and panels for real-time decision-making. |
This connectivity architecture enables high-impact operational applications, changing the work dynamics on the shop floor:
- – Dynamic dashboards: screens distributed throughout the factory show the current hour’s efficiency against the shift target. If the panel color changes from green to red, the team instantly knows that the pace has dropped.
- – Automated alarms and triggers: if a machine exceeds five minutes of unjustified inactivity, the system triggers an automatic alert to the maintenance team or operational leadership, shortening response times.
- – Immediate bottleneck analysis: real-time algorithms detect minor faults and slowdowns that would otherwise go unnoticed, alerting teams to component wear. Instead of debating in the next meeting why production capacity fell short, the team resolves the issue the moment it happens.
- – Integrated predictive maintenance: continuous monitoring of motor current and the thermal behavior of machines predicts failures before they cause a catastrophic breakdown.
As you can see, achieving excellence in efficiency measurement is a continuous process of operational maturity. The most competitive industries are not necessarily those that display the highest efficiency rates in their reports, but those that possess the greatest visibility over their losses and the capacity to act to correct them before they generate major impacts.
Calculating OEE effectively requires a commitment to data quality right from its source, attention to shop floor details, and an in-depth analysis of the components that make up the indicator.
By adopting practices that ensure reliable data, your company transforms OEE into a strategic tool to drive productivity, increase competitiveness, and sustain consistent results over the long term.